
DENVER For National Parks Week, Travel Lemming released a data-backed ranking of all 63 U.S. national parks. Big Bend National Park ranks high on the list at #13 while Guadalupe Mountains National Park falls behind at #52.
Travel Lemming’s national parks ranking is based on an analysis of data scoring each park across seven factors: affordability, accessibility, biodiversity, crowds, reviews, jobs, and weather.
The report revealed the following insights:
- Big Bend National Park ranks #13 overall in the U.S. Its high scores are largely due to favorable weather (#7), reviews (#23), crowds (#13), and biodiversity (#12). However, Big Bend loses points in the accessibility factor (#55) and is noted as being quite remote.
- Guadalupe Mountains National Park ranks #52 overall and scores quite low in reviews (#50), accessibility (#51), and jobs (#52). Still, it ranks #13 in the weather category, a factor that utilizes a human comfort-based system of temperature, humidity, precipitation, and lightning strikes.
- Several lesser-known and lesser-visited parks feature in the top 20, questioning conventional ideas of the best national parks in the USA.
- Ohio’s Cuyahoga Valley is the most affordable park, Hawai’i’s Haleakalā National Park has the best weather, Tennessee’s Great Smoky Mountains is the most biodiverse, Alaska’s Gates of the Arctic the least crowded, and Missouri’s Gateway Arch the most accessible.
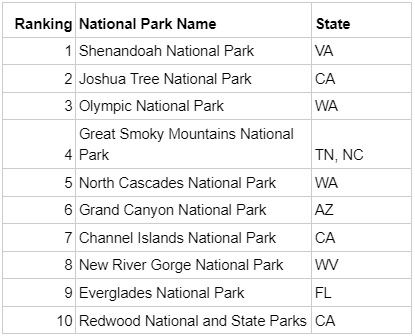
The top 10 U.S. national parks according to the report are:
Surprisingly, the most renowned national parks did not perform well in the rankings, largely due to the crowds and affordability factors. Yellowstone National Park ranks at position #16, Zion National Park at slot #18, and Yosemite National Park at slot #22.
Travel Lemming Writer Meg O’Connor commented: “As a data scientist and a huge fan of the outdoors, I love how much variety the United States has in its terrain, flora, and fauna. These data-driven rankings provide a numerical glimpse into how diverse our National Parks really are, and I feel like I could live several lifetimes and never get bored of visiting them.”
“Since we truly have some stunning hidden gems in our park system, I think these rankings will help draw attention to some of the lesser-known but absolutely awe-inspiring parks in this country.”
Methodology
National Parks were ranked on seven factors, based on the following data:
- Crowds – Number of visits per acre of park land in 2023. (Sources: NPS 2023 Recreation Visit Data, Wikipedia Acreage Data)
- Reviews – Average visitor review score out of 5. (Sources: Google Maps, Yelp, TripAdvisor)
- Weather – A human comfort-based points system based on monthly temperature, seasonal humidity, amount of precipitation, and number of cloud-to-ground lightning strikes. (Sources: NOAA, Current Results, American Meteorological Society, Lightning Safety Council, CDC)
- Affordability – Average spending per visitor per park in 2023 (Sources: NPS Visitor Spending Effects, NPS 2023 Recreation Visit Data)
- Accessibility – Average driving distance to the park from the closest FAA Primary Airport and the closest hub airport. (Sources: FAA, Google Maps Driving Distance, Wikipedia Major US Airports)
- Jobs – The total number of jobs associated with each national park as defined by the 2022 NPS Visitor Spending Effects Report (Sources: NPS)
- Biodiversity – Number of species deemed “present or probably present.” (Source: NPS Species List)
Overall rankings were determined by each park’s average ranking across all factors. Further details are available in the report’s methodology section.


